Annals of Neurosciences, Volume 18, Issue 4 (October), 2011
Effect of Naringenin on metabolic markers, lipid profile and expression of GFAP in C6 glioma cells implanted rat’s brain
KEY WORDS
Naringenin
C6 glioma
Metabolic marker
Lipid profile
GFAP
Corresponding Author:
V. A. Janardhanam, PhD
Tel : +914422202735
E-mail : sabkilbio@gmail.com
ABSTRACT
Background: Naringenin, a flavanone, has been reported to exhibit a wide range of pharmacological properties including antitumor activity. Purpose: We wanted to test the efficacy of Naringenin on C6 glioma cells-implanted into rats was investigated. Methods: Biochemical and immunohistochemical methods were used for analyzing various markers. Results: Injection of C6 glioma cells into rat brain resulted in increased metabolic markers {Lactatate Dehydrogenase (LDH), 5’ Nucleotidase (5’ ND), creatine kinase (CK), Hexokinase (HK) and Glucose 6-phosphate dehydrogenase (G6PD)} and lipid profile (triglycerides, free fatty acids, phospholipids, total cholesterol and free cholesterol). Oral administration of Naringenin (50 mg /kg of BW for 30 days) significantly altered this biochemical profile. Further, the immuno fluorescence expression of Glial fibrilary acidic protein (GFAP) was also studied. Conclusion: In C6 glioma cells-implanted rats, increased expression of GFAP was noted on treatment with Naringenin. These observations suggest that Naringenin may participate by inhibiting glial cell tumorigenesis.
doi : 10.5214/ans.0972.7531.1118406
Introduction
Gliomas are a type of brain tumors that arise from glial cells. Malignant gliomas (MGs), includes glioblastomas (GBMs), anaplastic astrocytomas (AAs) and astrocytomas (As) are the most common primary brain tumors.1 MGs are the most common primary intracranial tumours and strike earlier than other tumors.2 They are a challenging entity of tumours which represent more than 70% of all brain tumours.3 Many factors contribute to the aggressive nature of MGs. These include uncontrolled tumor proliferation, invasiveness into surrounding brain parenchyma, induction of tumoral angiogenesis, and inhibition of apoptotic pathways.4
Transplanted tumors in susceptible animals are a common model for experimental studies in oncology.5 The introduction of animal models in glioma research marks a major advance in the attempt to reach till a better understanding of tumor biology.6 Astrocytoma C6 is a well established in vitro cell line initially induced in rats by N-nitroso-methylurea.7 Rat induced with C6 glioma cells has been used extensively as an experimental model for the study of glioma.8 Implantation of C6 glioma intracerebrally into the rat brain induces a glioma more frequently than when injected subcutaneously9 and mimics the growth and pathological characteristics of human gliomas.10
Natural products with diverse bioactivities are becoming an important source of novel agents with pharmaceutical potential. Flavonoids are the most abundant antioxidants in human’s diet and have attracted a great deal of attention in recent years for their role in the prevention of chronic diseases.11 Among them, Naringenin (4’, 5, 7-trihydroxyflavanone; NGEN) is a predominant flavanone found in citrus fruits12 and has been reported to have several biological effects, such as anticancer13, anti-mutagenic14, and anti-inflammatory.15 Furthermore, it was found that NGEN was able to traverse the blood brain barrier.16 Hence, the present study was designed to understand the neuro protective role of NGEN on experimentally induced glioma by assessing metabolic markers, lipid profile and expression of GFAP in brain tissue, in order to study the efficacy of NGEN against C6 glioma cells-implanted rat brain.
Methods
Animal model
Male Wistar rats, weighing between 250 and 300 g, were purchased from King’s Institute, Guindy, Chennai, India and maintained under controlled environmental conditions. The animals were provided with pellet food (Gold Mohor rat feed, M/s. Hindustan Lever Ltd., Mumbai) and water ad libitum. This study was conducted according to the ethical norms approved by Ministry of Social Justices and Empowerment, Government of India and by Animal Ethics Committee Guidelines of our Institution (IAEC No. 01/012/08).
Chemicals
NGEN was purchased from M/s Sigma chemical company, USA. NUT.MIX.F-12 (HAMs) medium (Invitrogen) was purchased from Bio Corporals, India. Fetal bovine serum (FBS), penicillin-G, streptomycin and trypsin, were procured from Hi-Media laboratories, India. Xylazine was purchased from Indian immunologicals Ltd, India and ketamine was procured from Neon Laboratories, India. Primary anti- GFAP mouse monoclonal antibody was purchased from Santa Cruz, USA and anti-mouse FITC labeled secondary antibody was obtained from Genei, India. All other chemicals were purchased from M/s SRL chemicals, Mumbai, India.
C6 Glioma cell lines
Rat C6 glioma cell line was obtained from the NCCS, Pune, India and maintained in monolayers in 100-mm dishes at 37ºC under humidified 5 % CO2 - 95 % air. The cells were cultured in NUT.MIX.F-12 (HAMs) medium supplemented with fetal bovine serum (FBS 10 % final concentration), penicillin-G (50 unit/ml) and streptomycin (50 μg/ml). Cells were harvested during the log phase with a solution of 0.05% Trypsin and 0.02% EDTA, and re-suspended in HAM’s medium supplemented with FBS to a final concentration of 105 cells per 10μl for the implantation.
Experimental groups
Animals were divided into four groups with six animals in each group.
Group I (Control): Animals were injected with 10μ1 of MEM supplemented with 10 % FBS. Group II: Animals were injected with cell suspension of C6 glioma cells (10μl of MEM supplemented with 10 % FBS containing 105 cells) under a controlled pressure. Group III: Animals served as drug control (50 mg of NGEN administrated orally/kg BW for 30 days dissolved in 0.01% DMSO). Group IV: Rats were induced glioma as mentioned in group II and treated with NGEN as in group III (from the second day of tumor implantation for 30 days).
Tumor Implantation
Tumor implantation was carried out by the method of Nobuhisa et al.17 Rats were anesthetized by injection of xylazine (10 mg/kg, IM) and ketamine (100 mg/kg, IP). The animals were placed in a stereotactic surgical frame (Instrument & Chemicals Pvt Ltd, Ambala city, India). A small burrhole was drilled into the right side at a location defined by the following stereotactic coordinates: - 0.8 mm to the bregma; 4 mm medial to lateral; 5mm dorso ventral from the skull surface for the injection of C6 glioma cell suspension with a Hamilton microsyringe. The craniotomy was sealed with bone wax and overlying skin incision was closed.
Biochemical analysis
At the end of the experimental period, the animals were subjected to cervical decapitation. 100 mg of the whole brain tissue was weighed, uniformly homogenized with 1.0 ml of 0.5 M phosphate buffer, pH 6.9 and the homogenate was subjected to the following biochemical assays. Protein content was estimated by the method of Lowry et al.18
Assays of marker enzymes
The activities of LDH by the method of King19, CK by the method of Okinaka et al.20, 5 ND by Fini et al.21, G6PD by the method of Baquer and Mc Lean, 22 and HK by the method of Brandstrup et al.23 were estimated in brain tissues of control and experimental rats.
Estimation of lipid profile
Total lipid was extracted from the brain sample according to the method of Folch et al.24 Tissue cholesterol content was estimated by the method of Parekh and Jung.25 Free cholesterol was estimated by the method of Leffler and Mc Dougald.26 Phospholipids were estimated by the method of Rouser et al. 27 after digesting the lipid extract with perchloric acid. Triglycerides were estimated by the method of Rice.28 Free fatty acid content was estimated by the method of Horn and Menahan.29
Immunofluorescence study for GFAP
Immunofluorescence was performed on the portion of brain specimen fixed in 10% buffered formalin and embedded in paraffin wax. Sections were cut at 5 μm in thickness. The tissue sections were deparraffinized in two changes of xylene at 60ºC for 20 min each and hydrated through a graded series of alcohol, the slides were incubated in a citrate buffer (pH 6.0) for three cycles of 5 min each in a microwave oven for antigen retrieval. The sections were then allowed to cool to room temperature and then rinsed with TBS and treated with 0.3% H2O2 in methanol for 10 min to block endogenous peroxidase activity. Non-specific binding was blocked with 3% BSA at room temperature for 1 h. The sections were then incubated with diluted primary antibodies GFAP (1:100) at 4ºC overnight. The slides were washed with TBS and then incubated with anti-mouse FITC- labeled secondary antibody at a dilution 1:500 for 30 min in room temperature. Then they were washed thrice with TBS and mounted in glycerol: PBS mix (1:9). Then slides were viewed under fluorescence microscope using wavelength of 488 nm.
Statistical analysis
All the grouped data were significantly evaluated with SPSS/15 software. Hypothesis testing methods included one-way analysis of variance (ANOVA) followed by least significant difference (LSD) test. P values of > 0.05 were considered to indicate statistical significance. All the results were expressed as mean ± SD for six animals in each group.
Results
The activities of metabolic marker enzymes LDH, CK, 5’ ND, G6PD and HK in the brain tissue of control and experimental group of rats are shown in Table 1. These enzymes were found to be significantly increased (P>0.05) in glioma induced animals (Group II) when compared to that of control and these altered activities were significantly decreased (P>0.05) on NGEN treatment (Group IV).
Table 1: Effect of different dosages of NGEN on the activities of metabolic marker enzymes in the brain tissues of control and experimental animals.
| Particulars | Group I (control) | Group II (Glioma induced DPI) | Group III (NGEN control) | Group IV (Glioma induced + NGEN: 50 mg/kg of BW/30days) |
|---|---|---|---|---|
| 5’ NT | 3.36±0.84 | 15.85±2.06*a | 3.96±0.72NS | 9.04±1.65*bc |
| CK | 23.91±4.40 | 49.54±11.25*a | 24.12±2.65NS | 32.36±3.42*bc |
| LDH | 8.90±1.21 | 21.79±3.34*a | 9.01±1.40NS | 11.86±2.61*bc |
| HK | 10.64±1.84 | 29.84±2.67*a | 8.32±1.53NS | 18.37±2.25*bc |
| G6PD | 3.73±0.42 | 16.85±4.06*a | 3.04±0.86NS | 5.04±1.75*bc |
5’ NT- nmoles of Pi liberated/min/mg protein, Ck - μmcles of Pi liberated/min/mg protein, LDH- μmoles of pyruvayte liberated/min/mg protein and HK- nmoles of glucose- 6-phosphate liberated/min/mg protein and G6PD- μmoles of NADP+ reduced/min/mg of protein.
Statistical signigicance at *p>0.05; an Group I vs. Group II, b Group II vs. Group IV, c Group I vs. Group IV and NS non-significance Group III vs Group I.
Table 2: Effect of NGEN on the levels of lipids in the brain tissues of control and experimental animals.
| Particulars | Group I (control) | Group II (Glioma induced 30th DPI) | Group III (NGEN control) | Group IV (Glioma induced + NGEN: 50 mg/kg of BW/30days) |
|---|---|---|---|---|
| Total cholesterol | 31.5±4.21 | 59.20±9.82*a | 30.91±5.0NS | 48.36±5.18*bc |
| Free cholesterol | 10.6±1.8 | 18.15±2.04*a | 09.92±1.01NS | 13.08±1.25*bc |
| Triglycerides | 34.05±3.65 | 45.28±4.25*a> | 33.71±3.85NS | 36.09±7.64*bc |
| Free fatty acids | 09.87±1.2 | 15.45±2.86*a | 09.18±2.06NS | 12.96±1.86*bc |
| Phospholipids | 57.4±6.06 | 74.51±7.96*a | 55.29±8.59NS | 66.15±7.60*bc |
Total cholesterol, free cholesterol, triglycerides, free fatty acids and phospholipids – mg/gm tissue. Each value expressed as mean±S.D. for six rats in each group.
Statistical signigicance at *p>0.05; a Group I vs. Group II, b Group II vs. Group IV, c Group I vs. Group IV and NS non-significance Group III vs Group I.
The levels of brain triglycerides, free fatty acids, phospholipids, total cholesterol and free cholesterol in control and experimental groups have been shown in Table 2. There was a significant increase (p > 0.05) in the levels of triglycerides, free fatty acids, total cholesterol, free cholesterol, and phospholipids in glial tumour bearing group II animals when compared to that of control animals (Group I). NGEN administration significantly (p > 0.05) prevented these alterations when compared to that of glioma induced animals (Group II).
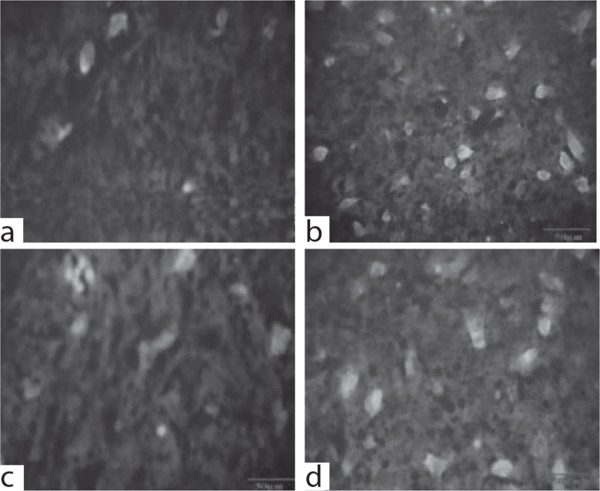
Immunofluorescence of GFAP of the experimental groups is shown in Figure 1. Figure 1a and 1c show the control and drug control groups exhibiting very low level of expression as evident from the reduced fluorescence in rat brain cells. GFAP positive cells were detected in tumour bearing rats with high intensity of expression (Fig. 1b). In contrast, group IV showed GFAP immunoreactivity with low intensity of expression when compared to that of group II (Fig 1d).
Discussion
Biochemical studies including metabolic markers and lipid profile are not only of significance for understanding tumour biology, but also for translational research.30 In oncology practice, the use of the biochemical studies may be helpful in the diagnosis and pathologic classification of tumours which may reflect both, stage of the disease and prognosis. Serial estimation after diagnosis may aid in assessing the response to treatment, in monitoring the spontaneous course of illness, and in keeping surveillance for tumour recurrences.31 We have earlier shown the in vitro anti-tumorogenic effect of NGEN on C6 glioma cells.32 We therefore sought to evaluate NGEN for its ability to alter glial tumour cell pathology for the first time with respect to such biochemical investigations and GFAP expression.
The most characteristic biochemical phenotype of malignant tumours lies in the propensity to satisfy their energy status.33 High rates of glycolysis have been found to be correlated with the pathological degree of malignancy in both non-central nervous system tumours34 and cerebral gliomas.35 HK is the enzyme responsible for initiating the glycolysis pathway and its activity in the brain tissues reflects the overall glucose utilization by brain cells. The G6PD activity is an index of nucleic acid synthesis converted from glucose through the pentose phosphate pathway. The experiments showed an elevated activity of HK and that of G6PD in C6 glioma cell implanted rats, explaining an increased demand of nucleic acid synthesis for cell proliferation and high glycolytic rate of tumour cells through the pentose phosphate pathway.36 The activities of these metabolic indicators of aggressive glial tumour proliferation were counteracted on NGEN treatment and thus perhaps against the implanted C6 cells in rat brain.
Fig. 1: a: Control (Group 1); b: Glioma induced (Group 2); c: Drug control (Group 3); d: Tumor induced + NGEN treated (Group 4). (Scale bar 50μm).
GFAP immuno-reactivity in brain tissues of control and experimental group of rats.
LDH a significant marker of solid neoplasm37 and found to be elevated in most of the gliomas.38 Recently, it was reported that there was an increased level of LDH expression in astrocytoma than that of normal39 which was concomitant with the present observation. The increased activity of LDH in glioma induced rats may be due to higher glycolysis in malignant conditions, which is the major energy producing pathway for the uncontrolled proliferating malignant glial cells.40
5’ NT is an endonuclease which is expressed on normal and neoplastic glial cell plasma membranes.41 The up-regulation of 5’-NT expression is allied with a highly invasive phenotype42, drug resistance and tumour-promoting functions.43 The inhibition of 5’ NT may result in a decrease in extracellular adenosine production with a consequent reduction in tumour progression.44 The increased activity of 5’ NT in glioma induced rats was comparable with the work of Parkinson et al.45 which reported that such an increase leads to an enhancement of cellular adenosine helping in the process of invasion, a signal for proliferation.46
CK, a key enzyme of energy homeostasis is seen in all of the tissues but predominantly in the brain.47 The activity of CK was found to be increased in various cancers and in glioma.48 The increased activity of CK in the brain of glioma induced rats suggests that the CK alters the brain cellular energy requirements by playing central role in regeneration of ATP as a proliferating tumour cells require high energy for fast cell division and invasion.49 The elevated activities of these glial-tumour related metabolic markers enzymes (CK, LDH, 5’ NT, HK and G6PD) in C6 glioma cells implanted rat brain were significantly reversed upon the administration of NGEN revealing the drug’s potential against glial tumour cell pathology, reflecting reduction of tumour burden.
Lipids are the structural components of cell membrane involved in maintaining integrity and fluidity of the cellular membrane components. The structural modification or alteration in the intracellular trafficking of cholesterol and other lipids shows the indication of pathological conditions.50 Furthermore, abnormal lipid synthesis or defective degradation of lipids has been implicated in pathological conditions like cancer51 including glioma.48 Thus, the potential of NGEN was also tested in decreasing the elevated lipids in rat glioma. The observed increase in the level of phospholipids, triglycerides and free fatty acids in glioma induced group II rats implicates their contribution to the growth and proliferation of growing cancer cells as suggested by Krämer et al.52 Previous findings have suggested that tumour growth is associated with an enhanced mobilization of stored triglycerides so that the resulting liberation of free fatty acids can be utilized for tumour growth53 as observed in group II rat brains implanted with C6 cells. However, such a scenario was altered by NGEN administration which thus, counteracts the growth and proliferation of implanted C6 glial cells in group IV rats.
GFAP is a member of the class III intermediate filament protein family. It is heavily and specifically, expressed in astrocytes and certain other regions in the central nervous system. Antibodies to GFAP are, therefore, very useful as markers of atrocity cells. In addition, many types of brain tumour presumably derived from atrocity cells, heavily express GFAP.54 High GFAP content can be detected also in malignant brain tumours.55 In accordance with the above reports, significantly higher expression of GFAP was encountered group II rats when compared to that of control, representing astrocytic tumour development which could be suppressed on NGEN treatment. This suppression of GFAP by NGEN might be argued as reduction of number of highly proliferative astrocytes. To conclude, thus these finding suggest that the NGEN supplementation to cerebrally implanted C6 glioma cells in rats could alters the glial tumorigenesis.
The article complies with International Committee of Medical Journal Editor’s uniform requirements for the manuscripts.
Competing interests – None, Source of Funding – None
Received Date : 21 July 2011; Revised Date: 10 August 2011
Accepted Date : 22 August 2011
References
1. Zulch, K.J. Brain tumors: Their biology and pathology 3rd Ed. Berlin-Heidelberg-New York: Springer Verlag .1986; 85–114.
2. Shapiro WR, Shapiro JR and Walker RW. Central Nervous System. In: Abeloff MD, Armitage JO, Lichter AS and Niederhuber JE, Ed. Clinical Oncology. Churchill Livingstone, New York. 1995; 851–912.
3. Ohgaki H and Kleihues P. Epidemiology and etiology of gliomas. Acta Neuropathologica 2005; 109: 93–108.
4. Onda K, Davis RL, Shibuya M, et al. Correlation between the bromodeoxyuridine labeling index and the MIB-1 and Ki-67 proliferating cell indices in cerebral gliomas. Cancer 1994; 74: 1921–1926.
5. Peterson D, Sheridan P and Brown W. Animal models for brain tumors: historical perspectives and future directions. J Neurosurg. 1994; 80: 865–876.
6. Vince GH, Bendszus M, Schweitzer T, et al. Spontaneous regression of experimental gliomas—an immunohistochemical and MRI study of the C6 glioma spheroid implantation model. Exp Neurol 2004; 190: 478–485.
7. Barde YA, Lindsay RM, Monard D, et al. New factor released by cultured glioma cells supporting survival and growth of sensory neurons. Nature 1978; 274: 818.
8. Ergüven M, Bilir A, Altug T, et al. Suramin Increased Telomerase Activity in the C6 Glioma/ Wistar Experimental Brain Tumor Model. Int J Biomedical science 2007; 3(2): 105–112.
9. Cohen J, Robins H, Javid, et al. Intracranial C6 glioma model in adult Wistar-Furth rats. J Neuro-Oncol 1990; 8: 95–96.
10. Stewart PA, Hayakawa K, Hayakawa E, et al. A quantitative study of blood-brain barrier permeability ultrastructure in a new rat glioma model. Acta Neuropathol (Berl) 1985; 67: 96–102.
11. Chen D, Chen MS, Cui QC, et al. Structure–proteasome– inhibitory activity relationships of dietary flavonoids in human cancer cells. Front. Biosci 2007; 12: 1935–1945.
12. Kawaii S, Tomono Y, Katase E, et al. HL-60 differentiating activity and flavonoid content of the readily extractable fraction prepared from citrus juices. J Agric Food Chem 1999; 47: 128–135.
13. So FV, Guthrie N. Chambers AF, et al. Inhibition of proliferation of estrogen receptor-positive MCF-7 human breast cancer cells by flavonoids in the presence and absence of excess estrogen. Cancer Letters 1997; 112: 127–133.
14. Choi JS, Park KY, Moon SH, et al. Antimutagenic effect of plant flavonoids in the Salmonella assay system. Pharmacal Research 1994; 17: 71-75.
15. Tordera M, Ferrandiz ML and Alcaraz MJ. Influence of anti-inflammatory flavonoids on degranulation and arachidonic acid release in rat neutrophils. Z Naturforsch [C] 1994; 49: 235–240.
16. Youdim KA, Dobbie MS, Kuhnle G, et al. Interaction between flavonoids and the blood-brain barrier: in vitro studies. J Neurochem 2003; 85: 180–192.
17. Nobuhisa N, Hiroshi S, Masaru A, et al. Invasion of experimental rat brain tumor: early morphological changes following microinjection of C6 glioma cells. Acta Neuropathol 1993; 86: 117–125.
18. Lowry OH, Rosebrough NJ, Farr AL, et al. Protein measurement with the Folin phenol reagent. J Biol Chem 1951; 193: 265–275.
19. King J. The dehydrogenases or oxidoreductases. Lactate dehydrogenase. In: Practical Clinical Enzymology. London: (ed) Van. D Nostrand, 1965:83–93.
20. Okinaka S, Kumogai H, Ebashi S, et al. Serum creatine phosphokinase activity in progressive muscular dystrophy and neuro muscular diseases. Arch Neurol 1961; 4: 520–525.
21. Fini C, Ipata PL, Palmerini CA, et al. 5’- nucleotidase from bull seminal plasma. Biochim Biophys Acta 1983; 14: 405–412.
22. Baquer NJ and Mc Lean P. Evidences for the existence and functional activity of pentose phosphate pathway enzymes in the large particle fraction isolate from rat tissues. Biochem Biophys Res commun 1972; 46: 167–174.
23. Brandstrup N, Kirk JE and Bruni C. Determination of hexokinase in tissues. J.Gerontology 1957; 12: 166–171.
24. Folch J, Lees M, Sloane Stanley GH. A simple method for the isolation and purification of total lipids from animal tissues. J Biol Chem 1957; 226: 497–509.
25. Parekh AC, Jung DH. Cholesterol determination with ferric acetate-uranium acetate and sulfuric acid-ferrous sulfate reagents. Anal Chem 1970; 42: 1423–1427.
26. Leffler HH, Mc Dougald CH. Estimation of cholesterol in serum by means of improved technics. Tech Bull Regist Med Technol 1963; 33: 19–23.
27. Rouser G, Fkeischer S, Yamamoto A. Two dimensional then layer chromatographic separation of polar lipids and determination of phospholipids by phosphorus analysis of spots. Lipids 1970; 5: 494–496.
28. Rice EW. Triglycerides (“neutral fats”) in serum. In Standard Methods of Clinical Chemistry 1970; 6: 215–22.
29. Horn WT, Menahan LA. A sensitive method for the determination of free fatty acids in plasma. J Lipid Res 1981; 22: 377–381.
30. Pamies RJ and Crawford DR. Tumor markers: an update. Med. Clin. North Am 1996; 80: 185–199.
31. Coombes RC and Powels TJ. Tumor markers in the management of human cancer. In: Deeley TJ (ed). Topical reviews in radiotherapy and oncology. Bristol, UK : Wright PGS. 1982; 39.
32. Sabarinathan D and Vanisree AJ. Naringenin, A flavanone alters the tumorigenic features of C6 glioma cells. Biomed. and Pharmcotherapy 2010; Doi:10.1016/j.biopha.2010.06.010.
33. Bustamante E and Pedersen PL. High aerobic glycolysis of rat hepatoma cells in culture: role of mitochondrial hexokinase. Proc Natl Acad Sci USA 1977; 74: 3735–3739.
34. Pederson PL. Tumor mitochondria and the bioenergetics of cancer cells. Prog Exp Tumor Res 1978; 22: 190–274.
35. Meixensberger J, Herting B, Roggendorf W, et al. Metabolic patterns in malignant gliomas. J Neuro-Oncol 1995; 24: 153–161.
36. Ikezaki K, Black KL, Conklin SG et al. Histochemical evaluation of energy metabolism in rat glioma. Neurol Res 1992; 14: 289–293.
37. Anbarasi K, Sabitha KE and Devi CSS. Lactate dehydrogenase isoenzyme patterns upon chronic exposure to cigarette smoke: protective effect of bacoside A. Environ Toxicol Pharmacol 2005; 20: 345–350.
38. Yun K. Early effects of ethylnitrosourea on the LDH isozyme of rat fetal central nervous system. Acta Pathol Jpn 1980; 30: 389–395.
39. Hara M, Yokota H, Ogashiwa M, et al. Biochemical monitoring of postoperative glioma. No To Shinkei 1981; 33: 505–511.
40. Helmes MH, Modia A, Moneim EL, et al. Clinical values of serum LDH, ceruloplasmin and lipid bound sialic acid in monitoring patients with malignant lymphomas. Med Sci Res 1998; 26: 613–617.
41. Ludwig HC, Rausch S, Schallock K, et al. Expression of CD 73 in 165 glioblastomas by immunohistochemistry and electromicroscopic histochemistry. Anticancer Res. 1999; 19(3a): 1747–1752.
42. Sadej R, Spychala J and Skladanowski AC. Expression of ecto- 50-nucleotidase (eN, CD73) in cell lines from various stages of human melanoma. Melanoma Res 2006; 16: 213–222.
43. Ujhazy P, Berleth ES, Pietkiewicz JM, et al. Evidence for the involvement of ecto-50-nucleotidase (CD73) in drug resistance. Int J Cancer 1996; 68: 493–500.
44. Wink MR, Lenz G, Braganhol E, et al. Alterted extracellular ATP ADP and AMP catabolism in Glioma cell lines. Cancer lett 2003; 20: 211–218.
45. Parkinson FE, Ferguson J, Zamzow CR, et al. Gene expression for enzymes and transporters involved in regulating adenosine and inosine levels in rat forebrain neurons, astrocytes and C6 glioma cells. J Neurosci Res 2006; 84: 801–808.
46. Ludwig HC, Rausch S, Schallock K, et al. Expression of CD 73 in 165 glioblastomas by immunohistochemistry and electromicroscopic histochemistry. Anticancer Res 1999; 19(3a): 1747–1752.
47. Tari S and Govila CP. Gargap Reigers Syndrome. J Oral Pathol Med 1991; 20 (10): 514–515.
48. Umadevi S, Sharmila P and Vanisree AJ. Studies on the neuroprotective role of Piper longum in C6 glioma induced rats. Invest New Drugs 2010;28(5):615–623.
49. Kuzhikandathil EV and Molloy GR. Proximal promoter of the rat brain creatine kinase gene lacks a consensus CRE element but is essential for the cAMP-mediated increased transcription in glioblastoma cells. J Neurosci Res 1999; 56(4): 371–385.
50. Dietschy JM and Turley SD. Cholesterol metabolism in the brain. Curr Opin Lipidol 2001; 12: 105–112.
51. Yuvaraj S, Premkumar VG, Vijayasarathy K, et al. Ameliorating effect of coenzyme Q10, riboflavin and niacin in tamoxifen-treated postmenopausal breast cancer patients with special reference to lipids and lipoproteins. Clin Biochem 2007; 40: 623–628.
52. Krämer SD, Schütz YB, Wunderli-Allenspach H, et al. Lipids in blood-brain barrier models in vitro II: Influence of glial cells on lipid classes and lipid fatty acids. In Vitro Cell Dev Biol Anim 2002; 38: 566–571.
53. Ramakrishnan G, Elinos-Baez CM, Jagan S, et al. Silymarin downregulates COX-2 expression and attenuates hyperlipidemia during NDEA-induced rat hepatocellular carcinoma. Mol Cell Biochem 2008; 313: 53–61.
54. Mauro A, Giordana MT, Migheli A , et al. Glial fibrillary acidic protein (GFAP) in rat brain tumors transplacentally induced by ethylnitrosourea (ENU). J Neurol Sci 1983; 61(3): 349–355.
55. Gullotta F, Schindler F, Schmutzler R, et al. AP in brain tumor diagnosis: possibilities and limitations. Pathol Res Pract 1985; 180(1): 54–60.