Annals of Neurosciences, Vol 16, No 2 (2009)
Annals of Neurosciences, Volume 16, Number 2, April 2009
A modified, rapid fluorometric method for the quantification of mitochondrial calcium
KEYWORDS
Mitochondrial calcium
Calcium green 5N
Fluorometry
Locking buffer
Corresponding Author
Amit S Korde
Phone (518) 262-6477
Fax (518) 262-8102
email: kordea@mail.amc.edu
ABSTRACT
Background: Calcium is an important cellular mediator in numerous physiological processes. Under pathological conditions, large influxes of Ca2+ into mitochondria may occur, leading to activation of “cell-death” pathways. Although there are several methods by which to monitor mitochondrial Ca2+ [Ca2+]m in vitro, current methods for quantifying [Ca2+]m in the living animal are limited. Purpose: Herein, we describe a rapid and simple method by which to quantify the levels of total [Ca2+]m in situ. Methods: The method relies on the presence of inhibitors of Ca2+ influx and efflux to prevent movement of Ca2+ during mitochondrial isolation followed by the lysing of the organelles to liberate the cation. Total [Ca2+]m is quantified using the fluorescent probe Calcium Green 5-N. Results: A standard linear relationship between calcium green 5-N fluorescence signal intensity as a result of increasing concentrations of Cacl2 indicates that the amount of mitochondria in the assay mixture does not interfere with the fluorescent signal. Asignificant increase in Ca2+ was observed, presumably due to the release of both bound and free Ca2+ from the mitochondria in response to Triton X-100 exposure. The pH of samples from both DNP- and DMSO- treated animals remained unaltered after solubilization with Triton X-100. Conclusion: The method is sensitive to in vivo perturbations, as demonstrated by decreases in [Ca2+]m following administration of the uncoupling agent 2, 4-dinitrophenol.
doi : 10.5214/ans.0972.7531.2009.160204
Introduction
Calcium (Ca2+) has been recently recognized as a critical factor in the mitochondrial control of cell death1. It is now well documented that when cytoplasmic Ca2+ is increased, mitochondria act as sinks for Ca2+ 2. Indeed, mitochondrial Ca2+ concentrations ([Ca2+]m) can increase from a physiological concentration of approximately 100 nΜ or less to greater than 5μΜ under pathological conditions. Although physiological increases in cytoplasmic Ca2+ are readily buffered by the mitochondria and then rapidly redistributed, abnormally high levels of [Ca2+]m can be deleterious and may initiate a cascade of events leading to either necrotic or apoptotic cell death1. Ca2+-mediated cell death may represent a final common pathway in a number of chronic and acute neurodegenerative conditions including Huntington’s disease and stroke3.
In order to completely understand the molecular events leading to cell death in animal models of neurodegeneration, it is necessary to quantify [Ca2+]m in vivo. Currently, there are several means with which to accomplish this. One such method relies on the infusion of [Ca2+] into the live animal followed by autoradiographic visualization of silver grains using electron microscopy4. Yet another method utilizes the oxalatepyroanti-manate technique to visualize intra-mitochondrial calcium precipitates using electron microscopy5. Although both of these methods provide high resolution, limitations of the former method includes the use of radioactivity and both methods are limited by the difficulties associated with quantification and tissue processing for imaging. More current methods rely on the use of fluorescent probes and visualization using either single6 or two-photon7 confocal microscopy. These semi quantitative methods, too, are sensitive and have proven useful in tissue culture studies; however they lack sufficient resolution to afford information of subcellular calcium levels in the whole animal. Recently, a method was devised that involves the isolation of mitochondria in a buffer that contains the cation chelator EDTA to minimize free Ca2+, ruthenium red to inhibit the mitochondrial uniporter and voltage-dependent anion channel (VDAC) and lacks Na+ to prevent extrusion of Ca2+ via the Na+/ Ca2+ antiporter8. The mitochondria are then ruptured using Triton X-100 and liberated calcium quantified using the fluorescent probe fura-2K+. A potential limitation of this method is the presence of EDTA in the isolation buffer which might shift the equilibrium of Ca2+ from inside the mitochondrial matrix to the buffer via efflux through the H+/Ca2+ antiporter and/or the permeability transition pore(PTP). In addition, because fura-2K+ is a ratiometric dye, calcium concentrations must be derived using a standard curve that requires the determination of the minimum fluorescence using a buffer containing EGTA and maximum fluorescence following the addition of saturating concentrations of Ca2+. In the method described herein, we have circumvented these issues by isolating mitochondria in a “locking buffer” that contains no chelators and includes inhibitors of currently described mitochondrial Ca2+ channels/pores to prevent either the influx or efflux of Ca2+ during tissue processing. In addition, the use of the non-ratiometric fluorescent probe Calcium Green 5-N, allows the liberated calcium concentration to be extrapolated from an easily generated standard curve.
Methods
Six to eight week-old (approx 30-35 grams) male C57 mice were used for all animal studies. All animal use procedures were in accordance with the NIH Guide for the Care and Use of Laboratory Animals and were approved by the Albany Medical College Institutional Animal Care and Use Committee. CGP 37157 was purchased from Tocris Inc. (Ellisville, MO). Ruthenium red, cyclosporin A, Triton X-100,2,4-dinitrophenol (DNP), DMSO and 2,4,6-trinitrophenol (TNP) were purchased from Sigma (St. Louis, MO.). Calcium Green 5-N and BECEF acid (2’,7’-bis-(2-carboxyethyl)-5-(and-6-)-carboxyfluorescein) were purchased from Molecular Probes (Eugene, OR.). All other chemicals were reagent grade.
In our initial studies, mitochondria were prepared from whole forebrain using a modification of the method of Sims9. In this assay, the whole brain was placed in 2 ml of isolation buffer (20 mM HEPES, 1% BSA, 75 mM sucrose, 215 mM mannitol, pH 7.2) that contained 1) 16 μΜ ruthenium red to block the mitochondrial inward transport of Ca2+ via the uniporter and extrusion via the sodium-independent antiporter and voltage-dependent anion channel (VDAC) 2) 10 μΜ cyclosporin A to prevent loss of Ca2+ via induction of the permeability transition and 3) 15 μΜ CGP-37157 to block outward flux of Ca2+ via the sodium-dependent antiporter. The concentrations of the inhibitors used to make this “locking buffer” approximate the concentrations that were successfully used in other in vitro preparations10,11,12. Neither Na+, which is required for activation of the sodium-independent antiporter, nor EGTA/EDTA was included in the locking buffer. The final pellet was taken up in the same buffer and 25, 50 or 100 g mitochondrial protein were placed in the wells of 96 well plates to which was added 5 μΜ Calcium Green 5-N in a final volume of 100 μl locking buffer. Total [Ca2+]m was determined by subtracting the background fluorescence of the intact mitochondrial preparation from the fluorescence intensity following solubilization of the organelles with 100 μΜ Triton X-100 15 min. Calcium Green 5-N has the advantage over esterified mitochondrial permeable probes in that it is not dependent on the mitochondrial membrane potential, does not require enzymatic cleavage by esterases and, once the mitochondria have been solubilized, will measure total [Ca2+]m (i.e. bound + free). Samples were read in 96 well plates using a ΒΙΟ-teck Synergy HT fluorometer using an excitation wavelength of 485nm and emission wavelength of 532 nm. Tissue concentrations were extrapolated from a standard curve that was generated using known concentrations of CaCI2. Protein concentrations were determined using the Bradford protein assay (Pearce, Rockford, IL). All experiments were replicated a minimum of three times and [Ca2+]m is expressed as nmol/mg mitochondrial protein.
Due to the ability of Calcium Green 5-N to fluoresce with changes in pH, we conducted a series of experiments to determine whether solubilization of mitochondria and the release of protons altered the buffer pH. Following preparation of mitochondria in locking buffer, tissue samples were incubated for 15 minutes with 10 μΜ of the fluorescent pH indicator BECEF before and after addition of 100 μΜ Triton X-100. Samples were read in 96 well plates with an excitation wavelength of 485 nm and emission wavelength of 532 nm. The pH of the samples was calculated by extrapolating the fluorescence from a standard curve that was generated using buffers of known pH and linear in a pH range from 4to pH 10 (not shown).
To determine whether this method could detect changes in [Ca2+]m in vivo, we treated a group of animals systemically with 2,4-dinitrophenol (DNP) (5 mg/kg in 60% DMSO i.p.). DNP is a mitochondrial uncoupler that can be used to decrease the mitochondrial membrane potential (ψm). Since the influx of cytoplasmic Ca2+ into the mitochondria is dependent on ψm13,2, we hypothesized that treatment with DNP would result in a reduction of [Ca2+]m. One hour following administration of 5 mg/kg DNP (in 60% DMSO), animals were sacrificed and mitochondria were prepared from forebrain as described above. In order to control for any non-specific effects of DNP, a control group of animals was administered the molar equivalent (6.2 mg/kg in 60% DMSO, i.p.) of the DNP analogue 2,4,6-trinitrophenol (TNP). Although TNP can uncouple submito-chondrial particles in which the inner mitochondrial membrane is inside-out, it is impermeable to intact mitochondrial membranes14 and thus would not be expected to alter ψm and, consequently, [Ca2+]m. Data were analyzed using Student’s Mest and are expressed as ± SEM.
Results
A standard curve was generated using locking buffer that contained 50 μg mitochondrial protein to which known concentrations of [Ca2+] was added. The corresponding fluorescence values were linear in the range from 100nM to 200 μΜ and the equation (y = mx + C) was used to describe the curve (Fig. 1, top curve). To make certain that the fluorescent signal resulted from the Ca2+ itself, another standard curve was generated in the presence of 100 μΜ EGTA and resulted, as expected, in the reduction of the fluorescent signal to levels nearing zero (Fig 1, bottom curve). A parallel set of standard curves generated in the presence of either lower (25 μg) or higher mitochondrial protein levels resulted in a slope that was essentially identical to that seen with 50 μg protein and indicates that the amount of mitochondria in the assay mixture does not interfere with the fluorescent signal.
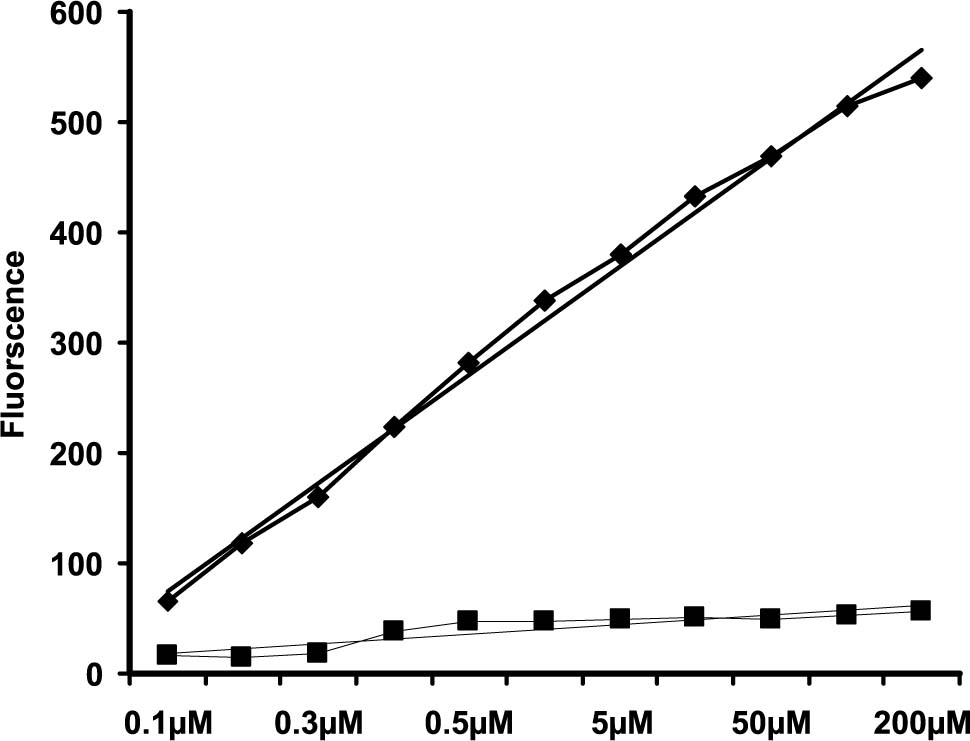
Figure 1. Standard curve (top curve) showing linear relationship between Calcium Green 5-N fluorescence signal intensity as a result of increasing concentrations of CaCI2 (top curve). The assay was carried out in the presence of 50 μg mitochondria in “locking” buffer containing 16 μΜ ruthenium red, 10 μΜ cyclosporin A and 15 μΜ CGP-37157. The bottom standard curve demonstrates the effects of 100 μΜ EGTA and indicates that the fluorescence intensity signal was the resu It of Ca2+ ions.
We next determined the background [Ca2+] using various protein concentrations of intact brain mitochondria from normal, untreated animals. Although the absolute amount of Ca2+ predictably increased with greater amounts of mitochondria, the values were essentially the same when these were normalized to total protein. Specifically, background Ca2+ was 0.37 ± 0.003 nmol/mg protein in 25 μg samples, 0.36 ± 0.012 nmol/mg proteins in 50 μg samples and 0.38 ± 0.009 nmol/mg proteins in 100 μg samples (Fig. 2). Following solubilization of mitochondria with Triton X-100, there was again a marked increase in [Ca2+] that, when normalized to protein levels were independent of the amount of mitochondria. In this experiment, (Ca2+]m was 7.63 ± 0.047 nmol/mg mitochondrial protein using 25 μg samples, 8.06 ± 0.097 nmol/mg mitochondrial protein in 50 μg, samples, and 7.77 ± 0.155 nmol/mg mitochondrial protein in 100 μg tissue samples (Fig. 2). Due of the similar results obtained with different concentrations of protein, we elected to use 50 μg of mitochondrial protein for the remaining experiments. Additionally, in view of the lack of variability of individual standard curves over time, a single standard curve in which 50 μg mitochondria protein was included in the buffer, was generated by averaging 6 curves prepared on sequential days and used in all subsequent experiments.
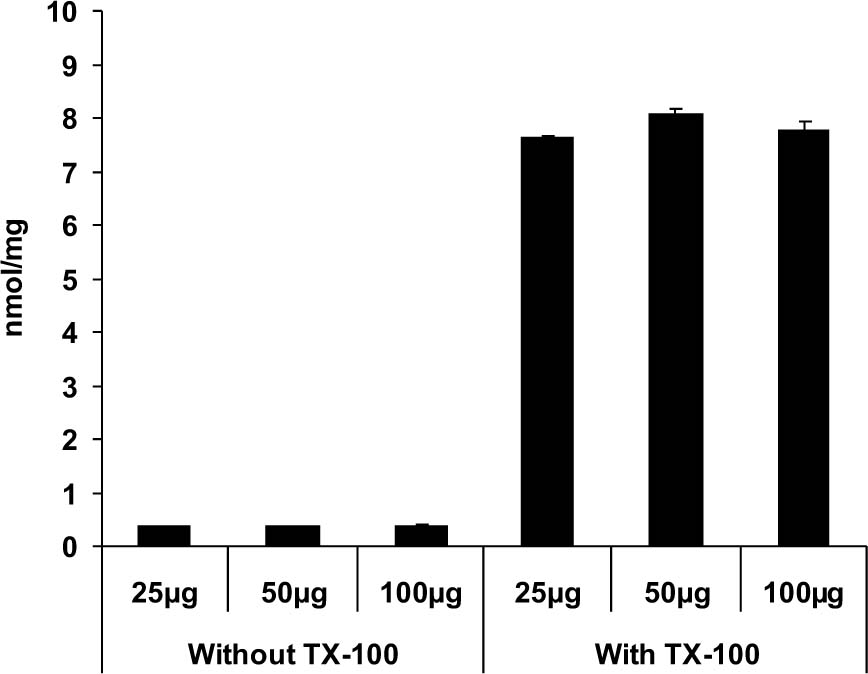
Figure 2. Effects of increasing protein concentration on Ca2+ levels in intact and Triton X-100 solubilized mitochondria. In the intact mitochondria, there is no decrease in background concentrations of Ca2+ as protein concentrations increase. Following exposure to Triton X-100, there is a marked increase in [Ca2+], presumably due to the release of both bound and free Ca2+from the mitochondrial matrix. As expected, the concentration of [Ca2+]m was constant and independent of the amount of mitochondria assayed.
To determine whether this method was sensitive to changes in Ca2+ mobilization in vivo, we treated a group of animals with DNP and another with DMSO and compared the two [Ca2+]m. Prior to solubilization there was no difference in [Ca2+]m in “locked” mitochondria between treatment groups (Fig. 3). Importantly, background Ca2+ levels from both groups were similar to that seen in intact mitochondria from normal, untreated animals (Fig. 3). Following lysis with Triton X-100, mitochondria prepared from animals administered DMSO revealed a [Ca2+]m of 6.99 ± 0.136 nmol/mg protein, consistent with what we observed in normal, untreated animals. In contrast, animals treated with DNP, showed an almost 60% reduction in [Ca2+]m compared to mitochondria from control animals (2.81 ± 0.148 nmol/mg vs. 6.99 ± 0.136 nmol/mg protein; p<0.001). To control for any non-specific effects of DNP, a third group of animals was systemically administered the molar equivalent of the structural analogue TNP. One hour following administration of TNP, [Ca2+]m was 7.06 ± 0.142 nmol/mg protein, which was not significantly different from DMSO-treated animals (Fig. 3).
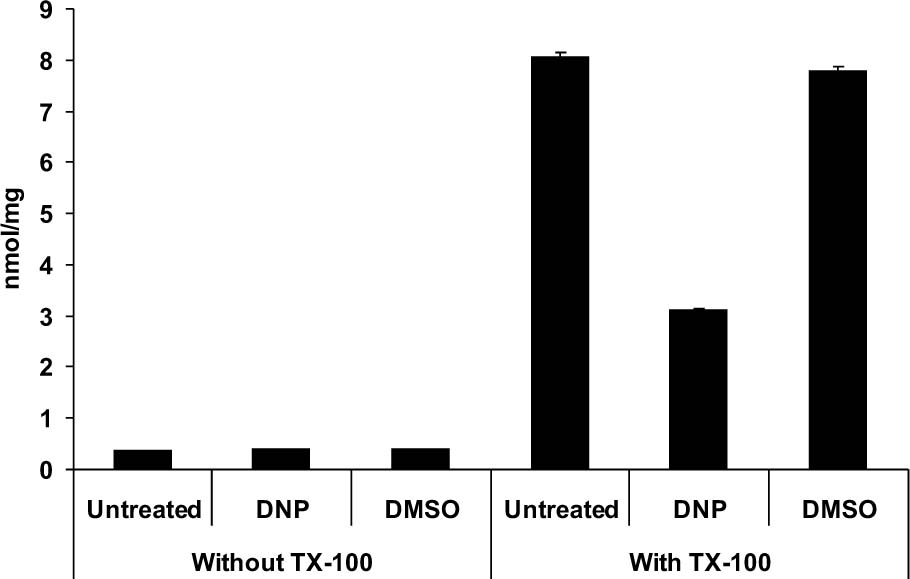
Figure 3. Effect of the mitochondrial uncoupler DNP on in vivo [Ca2+]m. The background Ca2+ in buffer containing intact mitochondria did not differ between treatment groups. Following solubilization with Triton X-100, Ca2+ concentrations in both DMSO-and TNP-treated groups increased markedly and [Ca2+]m was not different from that seen mitochondria prepared from normal, untreated animals (see Figure 1). In contrast, there is a significant decrease in [Ca2+]m in mitochondria prepared from an animal treated with 5 mg/kg DNP (p <. 0.001), consistent with a decrease in the mitochondrial membrane potential.
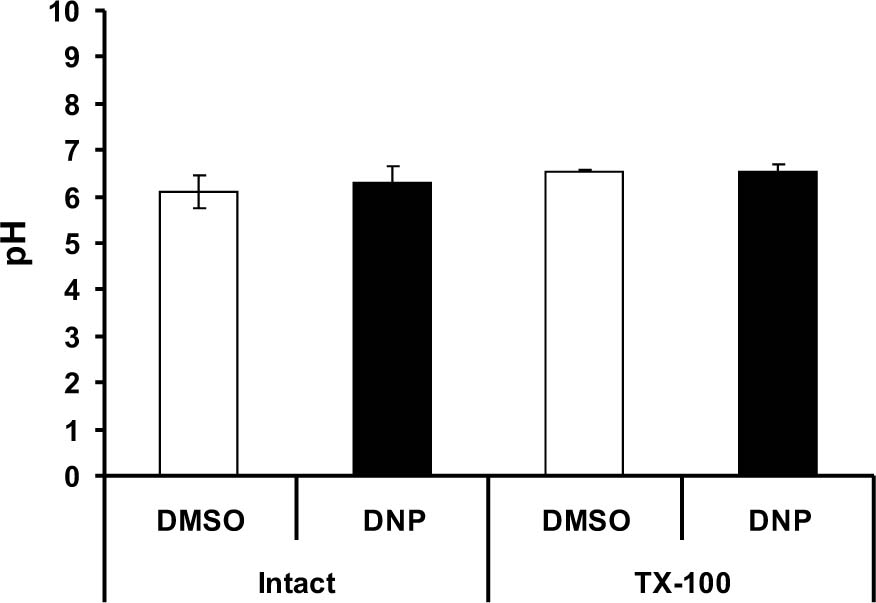
Figure 4. Effects of in vivo administration of DNP or DMSO on assay buffer pH. Animals were administered systemically either 5 mg.kg DNP or the molar equivalent of DMSO. One hour later, forebrain mitochondria were prepared. In intact mitochondria, there was no difference in BECEF fluorescence between treatment groups. Following solubilization with Triton X-100, the pH of samples from both DNP- and DMSO-treated animals remained unaltered. These observations suggest that the difference in [Ca2+]m between DNP-and DMS-treated animals was not due to changes in buffer pH following lysis of mitochondria.
Acidic environments can cause probes such as Calcium Green 5-N to fluoresce. To determine whether the coincidental release of protons from the lysed mitochondria affected buffer pH and, hence, florescence intensity, experiments were conducted in the presence of the pH indicator BECEF. In wells containing mitochondria from DMSO- and DNP-treated animals, the pH of the assay was 6.54 ±0.01528 and 6.5567 ± 0.1497 respectively. Following solubilization with Triton X-100, there was no change in the pH of either treatment group, indicating that the change in Calcium Green 5-N fluorescence is not due to the liberation of protons from mitochondria (Fig. 4).
Discussion
Mitochondrial calcium homeostasis is critically involved in mechanisms affecting both cell survival and cell death. While limited increases in [Ca2+]m can activate enzymes in response to increased cellular energy demands required for cell survival15, large rises in this same ion can stimulate pathways that result in either necrotic or apoptotic cell death1. In the central nervous system, elevations in [Ca2+]m have been implicated in both acute neuronal injury, such as stroke and traumatic spinal cord/brain injury, as well as in neurodegenerative disorders such as Huntington’s disease3. The ability to easily and reproducibly quantify in vivo [Ca2+]m in animal models for these disorders is thus of great utility.
Similar to a previously reported method8, we have relied on the use of “blockers” to prevent both the influx and efflux of [Ca2+]m during the isolation of the mitochondria, a detergent to rupture the mitochondria and liberate calcium and a fluorescent probe (Calcium Green 5-N) to quantify the liberated Ca2+. In the method of Zaiden and Sims, they used ruthenium red to block the mitochondrial inward transport of Ca2+ via the uniporter and extrusion via the sodium-independent antiporter and VDAC11. In addition to ruthenium red, our “locking” buffer included cyclosporin A to block the mitochondrial FTP16. The ability to block PTP is particularly important for measurements under pathological conditions as it is likely to be activated and may allow the flux Ca2+ during mitochondrial preparation. To prevent efflux of Ca2+ through the sodium dependent antiporter, Zaiden and Sims omitted Na+ from their “isolation” buffer of. We, too, omitted Na+ however we also added CGP-37157 to prevent activation of the sodium-dependent antiporter17 by stores of Na+ located within the mitochondrial matrix. Another difference between the previous method and the one reported here is the use of chelating agents during tissue preparation. In our method, there was no EDTA/EGTA present in the “locking” buffer, thus precluding a possible shift in the equilibrium of Ca2+ from the mitochondrial matrix into the buffer. Lastly, by using Calcium Green 5-N rather than the ratiometric dye fura-2K+, we were able to generate standard curves directly using known quantities of Ca2+. Despite the differences in the two methods, the concentrations of [Ca2+]m in “normal” mitochondria determined using this modified assay were only slightly higher than that reported previously.
DNP is an uncoupling agent that disconnects the flow of electrons down the electron chain from ATP synthesis by causing protons to “leak” back into the matrix form the inner mitochondrial space18. This short circuit results a reduction in the mitochondrial membrane potential and, thus, the driving force that is propels Ca2+ into the mitochondria13,2. In animals administered DNP, there was an almost 60% reduction in the concentration of [Ca2+]m compared to DMSO-treated control animals, consistent with a reduction in mitochondrial membrane potential. It should be pointed out that DNP may have some non-specific membrane effects, such as those leading to the release of catecholamines19. To control for these effects, we evaluated the effects of the DNP analogue TNP on [Ca2+]m. Like DNP, TNP interacts with the plasma membrane19 but unlike DNP lacks uncoupling activity in intact mitochondria14. In animals treated with the molar equivalent of this compound, there was no reduction in [Ca2+]m indicating the effect of if DNP on [Ca2+]m was due to its uncoupling properties and that this assay is sensitive to changes in [Ca2+]m in vivo. A limitation to this assay is that it does not differentiate between free and bound calcium in the matrix.
Although the effect is small, pH can affect the intensity of fluorescence following excitation. To be certain that the release of matrix protons did not change buffer pH, we used BECEF to measure buffer pH. The lack of change in fluorescence in buffer pH following lysis of the mitochondria indicates that the changes that we have measured are not a consequence of proton accumulation. In light of the observation that the addition of EGTA to solubilized mitochondrial causes a drop in Calcium Green 5-N fluorescence to near baseline levels, we conclude that the signal that we are measuring is, indeed, the result of liberated Ca2+ from the mitochondria.
Conclusion
This represents a modified method that allows for the quantification of in vivo mitochondrial calcium levels. The method provides sufficient sensitivity to measure experimentally induced changes in [Ca2+]min vivo and should be useful in studies aimed at determining concentrations of this ion in a number of models of neurodegenerative conditions in which altered [Ca2+]m has been implicated.
Competing interests - None, Source of Funding - None
Received Date : 9 March 2009; Revised Date : 31 March 2009
Accepted Date : 18 April 2009
References
1. Orrenius S., Zhivotovsky B. and Nicotera P. Regulation of cell death: the calcium-apoptosis link. Nat Rev Mol Cell Biol 2003; 4:552-565.
2. Gunter T. E., Gunter K. K., Sheu S.S. et al. Mitochondrial calcium transport: physiological and pathological relevance. Am J Physiol 1994; 267:C313-339.
3. Pandey P, Pradhan S. Homocysteine: A possible modifiable risk factor in vascular dementia. Annals of Neurosciences 2006; 13:12-18.
4. Howell S.L. and Tyhurst M. 45Calcium localization in islets of Langerhans, a study by electron-microscopic autoradiography. J Cell Sci 1976; 21:415-422.
5. Borgers M.,Thone F. and van NuetenJ. M. The subcellular distribution of calcium and the effects of calcium-antagonists as evaluated with a combined oxalate-pyroantimonate technique. Acta Histochem Suppl 1981; 24:327-332.
6. Peng T. I. and Greenamyre J. T. Privileged access to mitochondria of calcium influx through N-methyl-D-aspartate receptors. Mol Pharmacol 1998; 53:974-980.
7. Yuste R. and Denk W. Dendritic spines as basic functional units of neuronal integration. Nature 1995; 375:682-684.
8. Zaidan E. and Sims N. R. The calcium content of mitochondria from brain subregions following short-term forebrain ischemia and recirculation in the rat. J Neurochem 1994; 63: 1812-1819.
9. Sims N. R. Rapid isolation of metabolically active mitochondria from rat brain and subregions using Percoll density gradient centrifugation. J Neurochem 1990; 55: 698-707.
10. Petronilli V., Cola C. and Bernardi P. Modulation of the mitochondrial cyclosporin A-sensitive permeability transition pore. II. The minimal requirements for pore induction underscore a key role for transmembrane electrical potential, matrix pH, and matrix Ca2+. J Biol Chem 1993; 268:1011-1016.
11. Tapia R. and Velasco I. Ruthenium red as a tool to study calcium channels, neuronal death and the function of neural pathways. Neurochem Int1997; 30: 137-147.
12. Scanlon J. M., Brocard J. B., Stout A. K. et al. Pharmacological investigation of mitochondrial ca(2+) transport in central neurons: studies with CGP-37157, an inhibitor of the mitochondrial Na(+)-Ca(2+) exchanger. Cell Calcium 2000; 28: 317-327.
13. Nicholls D. G. and Ferguson S. J. Bioenergetics 2. Academic Press, San Diego1992.
14. Hanstein W. G. A. H., Y. Trinitrophenol: a membrane-impermeable uncoupler of oxidative phosphorylation. Proc Natl Acad Sci U S A 1974; 71: 288-292.
15. Brini M. Ca(2+) signalling in mitochondria: mechanism and role in physiology and pathology. Cell Calcium 2003; 34: 399-405.
16. Broekemeier K. M., Dempsey M. E. and Pfeiffer D. R. Cyclosporin A is a potent inhibitor of the inner membrane permeability transition in liver mitochondria. J Biol Chem 1989; 264: 7826-7830.
17. Cox D. A., Conforti L, Sperelakis N. and Matlib M. A. Selectivity of inhibition of Na(+)-Ca2+ exchange of heart mitochondria by benzothiazepine CGP-37157. J Cardiovasc Pharmacol 1993; 21: 595-599.
18. Boveris A. and Chance B. The mitochondrial generation of hydrogen peroxide. General properties and effect of hyperbaric oxygen. Biochem J 1973; 134: 707-716.
19. Sorimachi M. and Yamagami K. Nitriphenol compound induces Ca-dependent exocytotic secretion of catecholamines by a direct effect on the plasma membranes of the adrenal medullary cells. Brain Res 1982; 232: 242-246.
(c) Annals of Neurosciences.All Rights Reserved